Acacia Research (ACTG) - Stock Price & Dividends
Exchange: USA Stocks • Country: United States • Currency: USD • Type: Common Stock • ISIN: US0038813079
Patents, Printers, Consumable Products, Energy Assets
Acacia Research Corporation, together with its subsidiaries, invests in intellectual property and related absolute return assets; and engages in the licensing and enforcement of patented technologies. The company operates through three segments, Intellectual Property Operations, Industrial Operations, and Energy Operations. The company owns or controls the rights to various patent portfolios, which include U.S. patents and foreign counterparts covering technologies used in a range of industries. It also owns, manufactures, and distributes printers and consumable products through dealers and distributors for various industrial printing applications. In addition, the company offers supply-chain printing solutions for manufacturing, transportation and logistics, retail distribution, food and beverage distribution, and pharmaceutical distribution industries; and line matrix printers for mission critical applications within labeling and inventory management, build sheets, invoicing, manifests and bills of lading, and reporting industries. Further, it involved in the acquisition, production and development of oil and gas assets. Acacia Research Corporation was incorporated in 1993 and is headquartered in New York, New York. Web URL: https://www.acaciaresearch.com
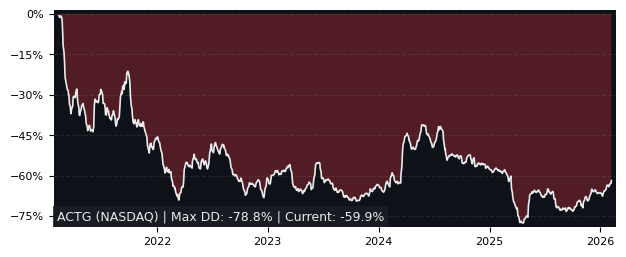
Drawdown (Underwater) Chart
Overall Trend and Yearly Seasonality

ACTG Stock Overview
| Market Cap in USD | 518m |
| Sector | Industrials |
| Industry | Business Equipment & Supplies |
| GiC SubIndustry | Research & Consulting Services |
| TER | 0.00% |
| IPO / Inception | 1996-07-08 |
ACTG Stock Ratings
| Growth 5y | 2.65 |
| Fundamental | 34.8 |
| Dividend | 0.51 |
| Rel. Performance vs Sector | 0.09 |
| Analysts | 5.00/5 |
| Fair Price Momentum | 4.93 USD |
| Fair Price DCF | - |
ACTG Dividends
| Yield 12m | 0.00% |
| Yield on Cost 5y | 0.00% |
| Dividends CAGR 5y | 0.00% |
| Payout Consistency | 10.6% |
ACTG Growth Ratios
| Growth 12m | 29.27% |
| Growth Correlation 12m | 25% |
| Growth Correlation 3m | 37% |
| CAGR 5y | 11.04% |
| CAGR/Mean DD 5y | 0.33 |
| Sharpe Ratio 12m | 0.67 |
| Alpha vs SP500 12m | 4.77 |
| Beta vs SP500 5y weekly | 0.80 |
| ValueRay RSI | 86.27 |
| Volatility GJR Garch 1y | 37.47% |
| Price / SMA 50 | 7.51% |
| Price / SMA 200 | 29.9% |
| Current Volume | 442.1k |
| Average Volume 20d | 199.8k |
External Links for ACTG Stock
News
Wall Street Journal • Benzinga • Yahoo Finance
Tweets
X • Stocktwits
Fund Manager Positions
Dataroma • Stockcircle
Wall Street Journal • Benzinga • Yahoo Finance
Tweets
X • Stocktwits
Fund Manager Positions
Dataroma • Stockcircle
What is the price of ACTG stocks?
As of May 16, 2024, the stock is trading at USD 5.30 with a total of 442,083 shares traded.
Over the past week, the price has changed by +2.32%, over one month by +7.07%, over three months by +21.84% and over the past year by +32.50%.
As of May 16, 2024, the stock is trading at USD 5.30 with a total of 442,083 shares traded.
Over the past week, the price has changed by +2.32%, over one month by +7.07%, over three months by +21.84% and over the past year by +32.50%.
What is the forecast for ACTG stock price target?
According to ValueRays Forecast Model, ACTG Acacia Research will be worth about 5.5 in May 2025. The stock is currently trading at 5.30. This means that the stock has a potential upside of +3.21%.
According to ValueRays Forecast Model, ACTG Acacia Research will be worth about 5.5 in May 2025. The stock is currently trading at 5.30. This means that the stock has a potential upside of +3.21%.
| Issuer | Forecast | Upside |
|---|---|---|
| Wallstreet Target Price | 7 | 32.1 |
| Analysts Target Price | 6 | 13.2 |
| ValueRay Target Price | 5.5 | 3.21 |