WW Grainger (GWW) - Stock Price & Dividends
Exchange: USA Stocks • Country: United States • Currency: USD • Type: Common Stock • ISIN: US3848021040
W.W. Grainger, Inc. is a leading distributor of maintenance, repair, and operating (MRO) products and services, catering to a diverse range of customers across North America, Japan, the UK, and other international markets.
The company operates through two primary segments: High-Touch Solutions N.A. and Endless Assortment. The High-Touch Solutions N.A. segment focuses on providing personalized services and solutions to customers, while the Endless Assortment segment offers a vast array of products through its e-commerce platform.
Grainger's extensive product portfolio includes safety and security equipment, material handling and storage solutions, pumps and plumbing equipment, cleaning and maintenance supplies, and metalworking and hand tools. Additionally, the company provides technical support and inventory management services to help customers optimize their operations.
The company serves a broad customer base, including small businesses, large corporations, government entities, and institutions from various industries such as commercial, healthcare, and manufacturing. Grainger's sales and service representatives, along with its electronic and e-commerce channels, ensure that customers receive tailored solutions and support.
Founded in 1927, W.W. Grainger, Inc. is headquartered in Lake Forest, Illinois, and has established itself as a trusted partner for businesses seeking to improve their operational efficiency and productivity. With a strong online presence, customers can easily access Grainger's products and services through its website at https://www.grainger.com.
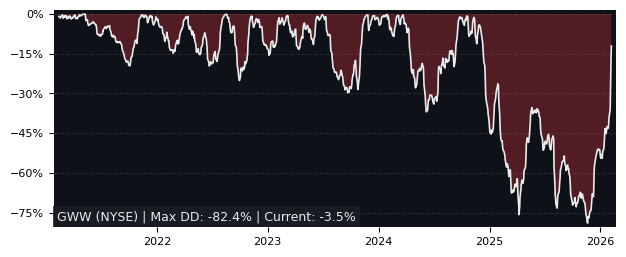
Drawdown (Underwater) Chart
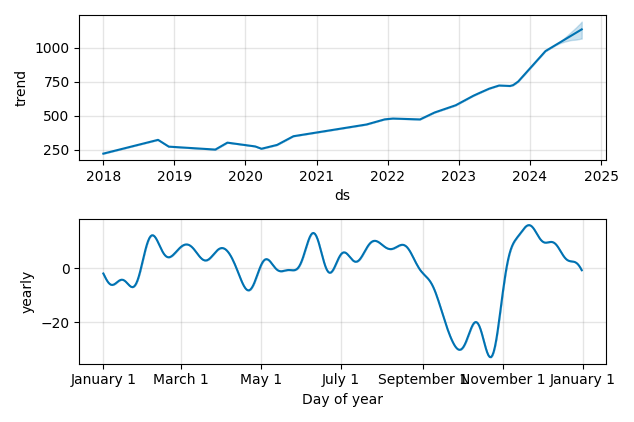
Overall Trend and Yearly Seasonality
GWW Stock Overview
| Market Cap in USD | 46,623m |
| Sector | Industrials |
| Industry | Industrial Distribution |
| GiC SubIndustry | Trading Companies & Distributors |
| TER | 0.00% |
| IPO / Inception | 1984-12-17 |
GWW Stock Ratings
| Growth 5y | 9.14 |
| Fundamental | 82.0 |
| Dividend | 6.89 |
| Rel. Performance vs Sector | 0.97 |
| Analysts | 3.25/5 |
| Fair Price Momentum | 1098.88 USD |
| Fair Price DCF | 1009.94 USD |
GWW Dividends
| Yield 12m | 0.80% |
| Yield on Cost 5y | 3.02% |
| Dividends CAGR 5y | 5.15% |
| Payout Consistency | 100.0% |
GWW Growth Ratios
| Growth 12m | 44.04% |
| Growth Correlation 12m | 66% |
| Growth Correlation 3m | -17% |
| CAGR 5y | 30.53% |
| CAGR/Mean DD 5y | 5.08 |
| Sharpe Ratio 12m | 1.90 |
| Alpha vs SP500 12m | 15.16 |
| Beta vs SP500 5y weekly | 0.98 |
| ValueRay RSI | 49.70 |
| Volatility GJR Garch 1y | 21.15% |
| Price / SMA 50 | -1.34% |
| Price / SMA 200 | 15.03% |
| Current Volume | 288.9k |
| Average Volume 20d | 260.5k |
External Links for GWW Stock
Wall Street Journal • Benzinga • Yahoo Finance
Tweets
X • Stocktwits
Fund Manager Positions
Dataroma • Stockcircle
As of May 16, 2024, the stock is trading at USD 958.15 with a total of 288,900 shares traded.
Over the past week, the price has changed by +1.19%, over one month by +0.50%, over three months by +1.75% and over the past year by +44.23%.
According to ValueRays Forecast Model, GWW WW Grainger will be worth about 1220.7 in May 2025. The stock is currently trading at 958.15. This means that the stock has a potential upside of +27.41%.
| Issuer | Forecast | Upside |
|---|---|---|
| Wallstreet Target Price | 1035.3 | 8.06 |
| Analysts Target Price | 778.1 | -18.8 |
| ValueRay Target Price | 1220.7 | 27.4 |